Section II: Expenditure Overview
Actual Expenditures
Budgetary Financial Resources (dollars)
|
2015–16 |
2015–16 |
2015–16 |
2015–16 |
Difference |
|
$524,851,120 |
$524,851,120 |
$546,403,730 |
$543,426,832 |
$18,575,712 |
Human Resources (FTEs)
|
2015–16 |
2015–16 |
2015–16 |
|
66 |
63 |
(3) |
Budgetary Performance SummaryBudgetary Performance Summary for Program(s) and Internal Services (dollars) |
||||||||
|
Program(s) and Internal Services |
2015–16 |
2015–16 |
2016–17 |
2017–18 |
2015–16 Total Authorities Available for Use |
2015–16 |
2014–15 |
2013–14 |
|
Payments pursuant to the Judges Act |
514,430,443 |
514,430,443 |
544,838,708 |
558,662,575 |
532,643,045 |
532,643,045 |
505,689,613 |
490,350,437 |
|
Canadian Judicial Council |
1,699,615 |
1,699,615 |
1,706,144 |
1,706,144 |
3,775,296 |
2,488,907 |
3,073,719 |
1,681,809 |
|
Federal Judicial Affairs |
7,994,262 |
7,994,262 |
7,902,601 |
7,902,601 |
9,258,589 |
7,576,944 |
8,130,290 |
8,455,757 |
|
Internal Services |
726,800 |
726,800 |
726,800 |
726,800 |
726,800 |
717,936 |
726,804 |
854,278 |
|
Total |
524,851,120 |
524,851,120 |
555,174,253 |
568,998,120 |
546,403,730 |
543,426,832 |
517,620,426 |
501,342,281 |
The actual spending for the department shows a continual increase over the reporting periods resulting from: an increase in funding to the Canadian Judicial Council for the costs of investigations and inquiries under the Judges Act; the annual increase in judges’ salaries based on the Industrial Aggregate as provided for in the Judges Act; and an increase in the number of judges appointed to the bench and the number of pensioners receiving benefits under the Judges Act.
Departmental Spending Trend
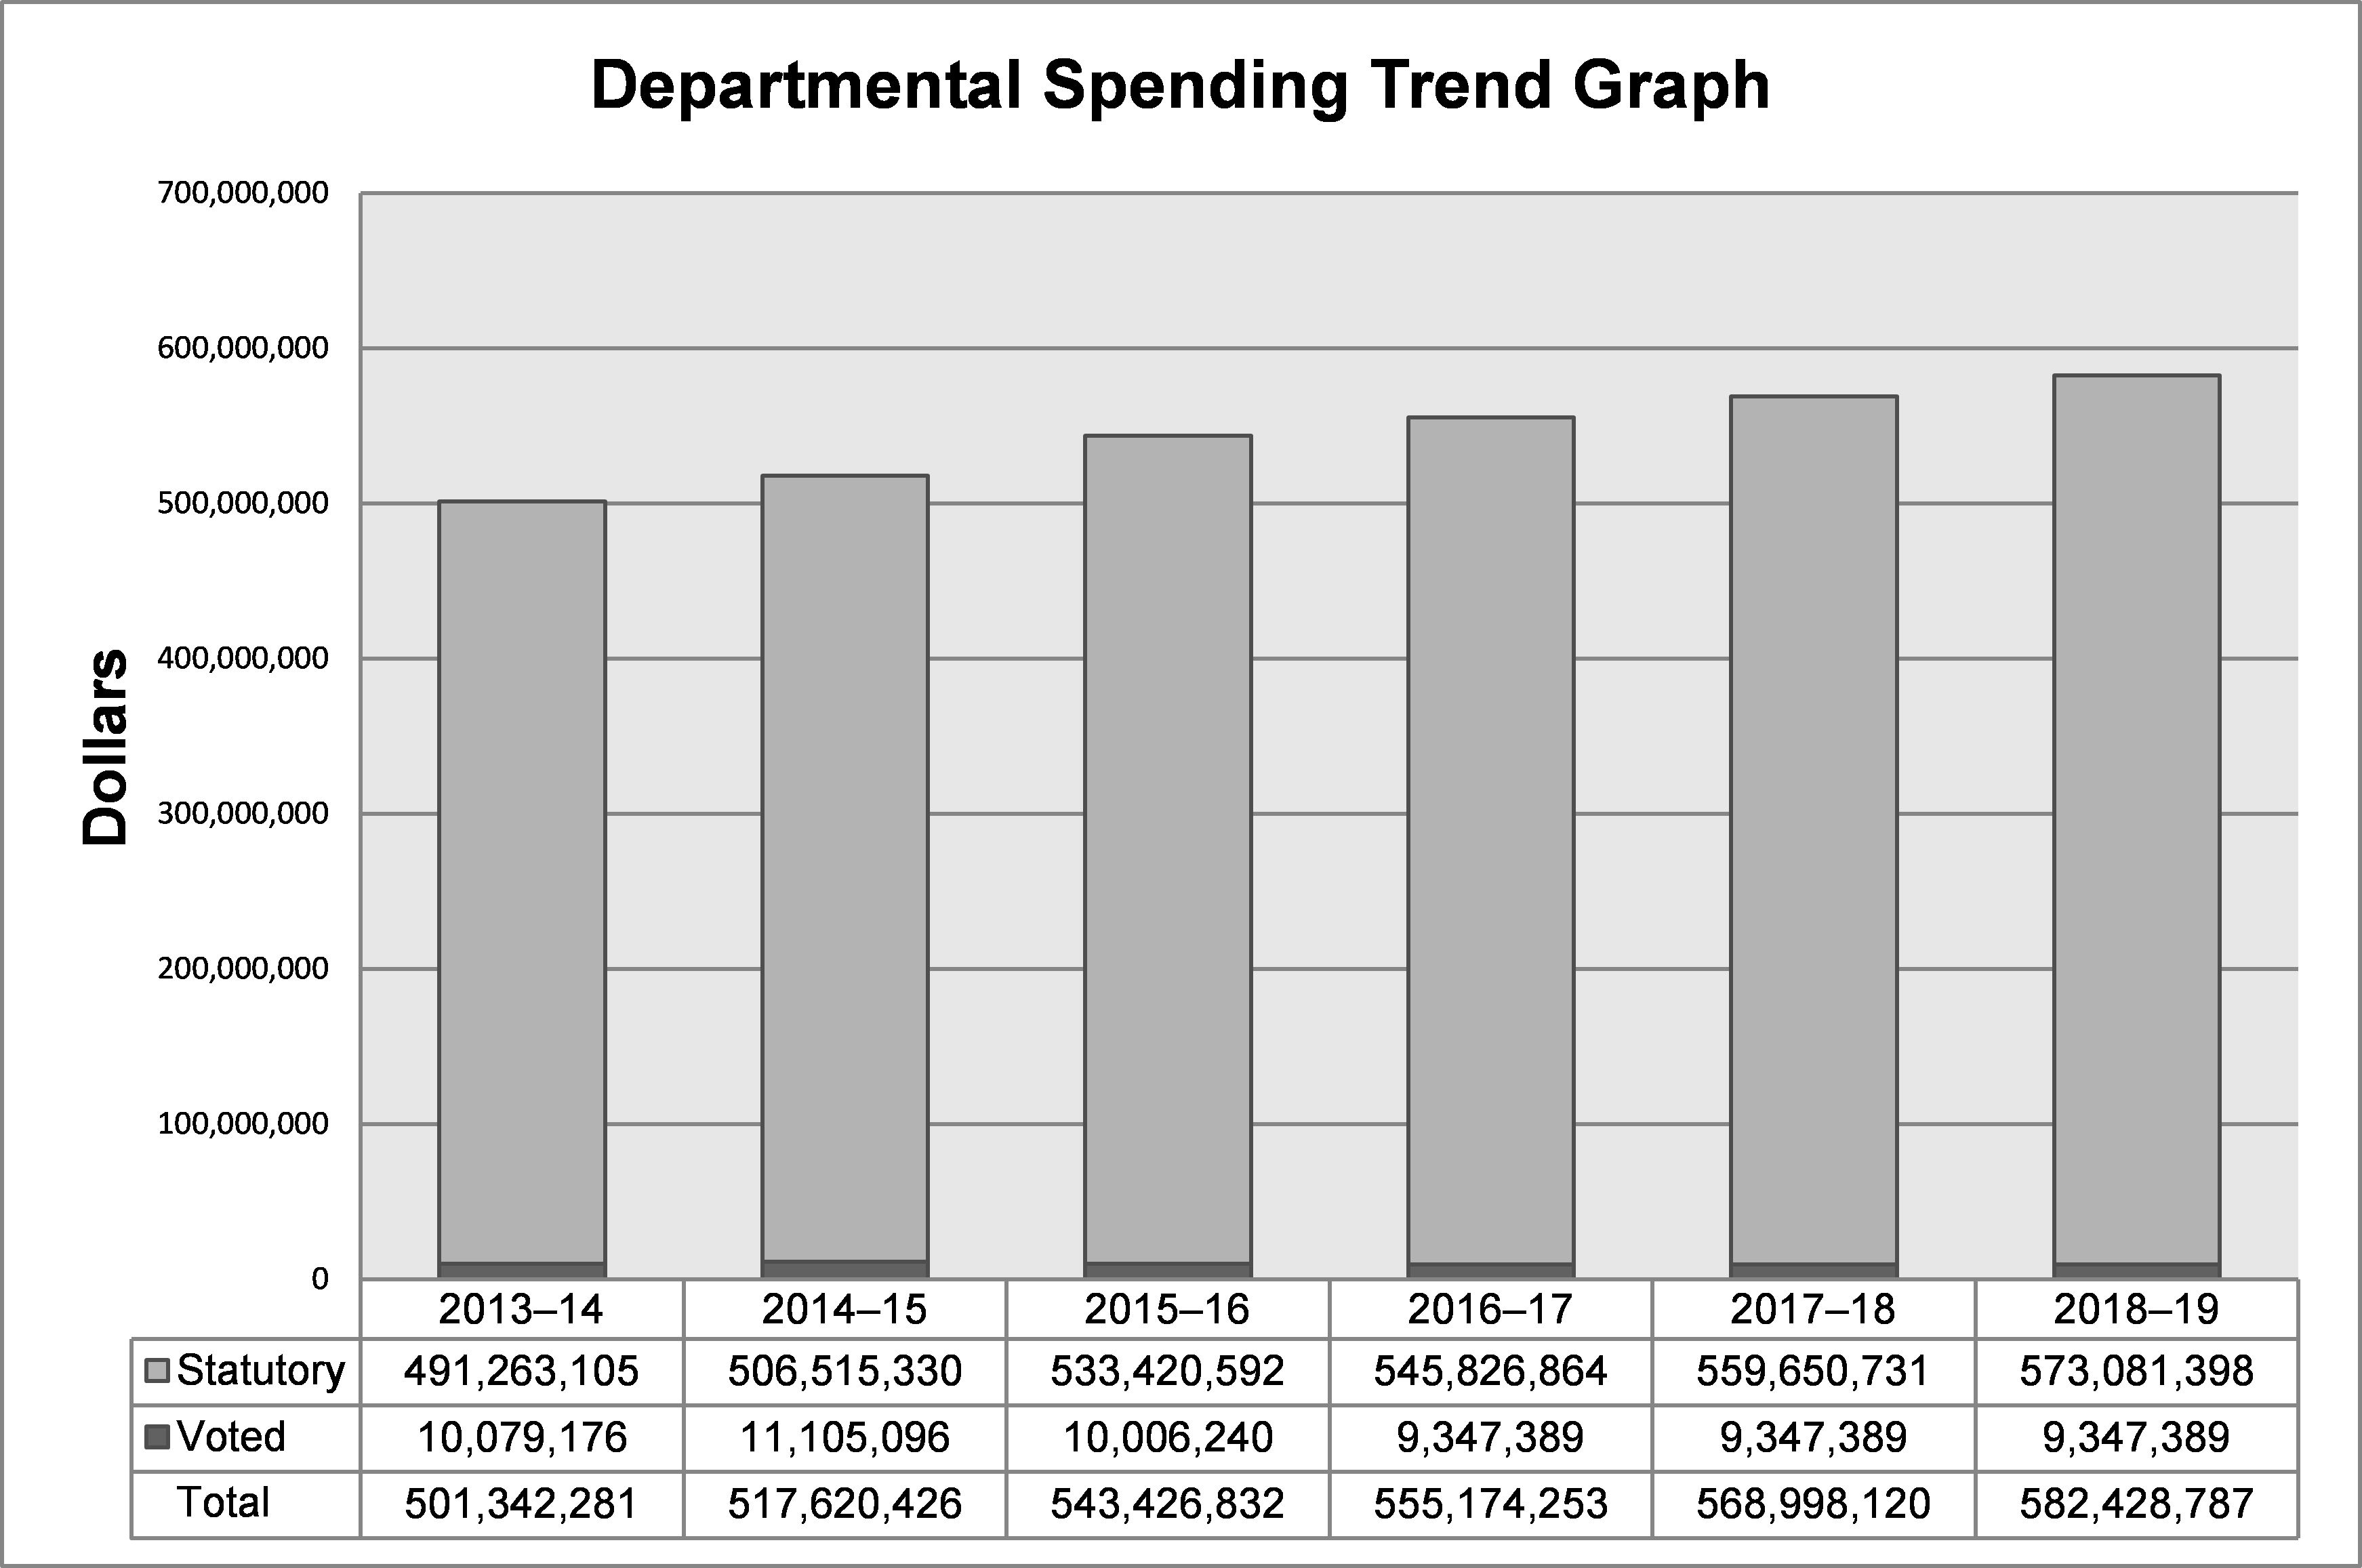
The $18.6M variance between the total planned and actual spending is mainly attributable to an overall $18.2 million increase in statutory expenditures for judge’s salaries, the increased number of judicial appointments and the increased number of pensioners. An additional $0.4 million represents an increase to department’ operating expenses related to legal obligations.
Expenditures by Vote
For information on FJA’s organizational voted and statutory expenditures, consult the Public Accounts of Canada 2016.
Alignment of Spending With the Whole-of-Government Framework
Alignment of 2015-16 Actual Spending With the Whole-of-Government Framework (dollars)
|
Program |
Spending Area |
Government of Canada Outcome |
2015–16 Actual Spending |
|
Payments pursuant to the Judges Act |
Social affairs |
A safe and secure Canada |
532,643,045 |
|
Canadian Judicial Council |
Social affairs |
A safe and secure Canada |
2,488,907 |
|
Federal Judicial Affairs |
Social affairs |
A safe and secure Canada |
7,576,944 |
Total Spending by Spending Area (dollars)
|
Spending Area |
Total Planned Spending |
Total Actual Spending |
|
Economic affairs |
0 |
0 |
|
Social affairs |
524,124,320 |
542,708,896 |
|
International affairs |
0 |
0 |
|
Government affairs |
0 |
0 |
Financial Statements and Financial Statements Highlights
Financial Statements
Financial Statements Highlights
|
Condensed
Statement of Financial Position (unaudited) |
|||||||
|
Financial Information |
2015–16 |
2015–16 |
2014–15 |
Difference (2015–16 actual minus 2015–16 planned) |
Difference (2015–16 actual minus 2014–15 actual) |
|
|
|
Total expenses |
527,052,000 |
545,177,362 |
519,145,636 |
18,125,362 |
26,031,726 |
|
|
|
Total revenues |
14,575,000 |
15,006,147 |
14,343,718 |
431,147 |
662,429 |
|
|
|
Net cost of operations before government funding and transfers |
512,477,000 |
530,171,215 |
504,801,918 |
17,694,215 |
25,369,297 |
|
|
The departmental Net cost of operations shows an increase of $25.4 million over the previous fiscal year. This increase is a result of a provision in the Judges Act that allows for an annual increase in salaries to judges based on the Industrial Aggregate and an increase in the number of pensioners receiving benefits under the Judges Act.
|
Condensed
Statement of Financial Position (unaudited) |
|||
|
Financial Information |
2015–16 |
2014–15 |
Difference |
|
Total net liabilities |
(216,722,633) |
(208,258,964) |
(8,463,669) |
|
Total net financial assets |
576,387 |
238,027 |
338,360 |
|
Departmental net debt |
(216,146,246) |
(208,020,937) |
(8,125,309) |
|
Total non-financial assets |
194,325 |
482,084 |
(287,759) |
|
Departmental net financial position |
(215,951,921) |
(207,538,853) |
(8,413,068) |
Net liabilities for 2015-16 are comprised primarily of $3.2 million in accrued liabilities and $213 million for the Judges’ Supplementary Retirement Benefits Account (SRBA). The SRBA is the pension plan for federally appointed judges which provides fully indexed annuities to judges and to all eligible survivors providing they meet minimum age and service requirements. Unlike other pension plans, the judges’ plan lacks an explicit accrual rate for benefits. Instead the full benefit amount is generally payable when the member has completed 15 years of pensionable service and the total of the member’s age and years of service totals 80. The increase of $8.5 million in net liabilities over last fiscal year is fully attributable to the actuarial liability associated with the SRBA.
- Date modified: